2023-09-30
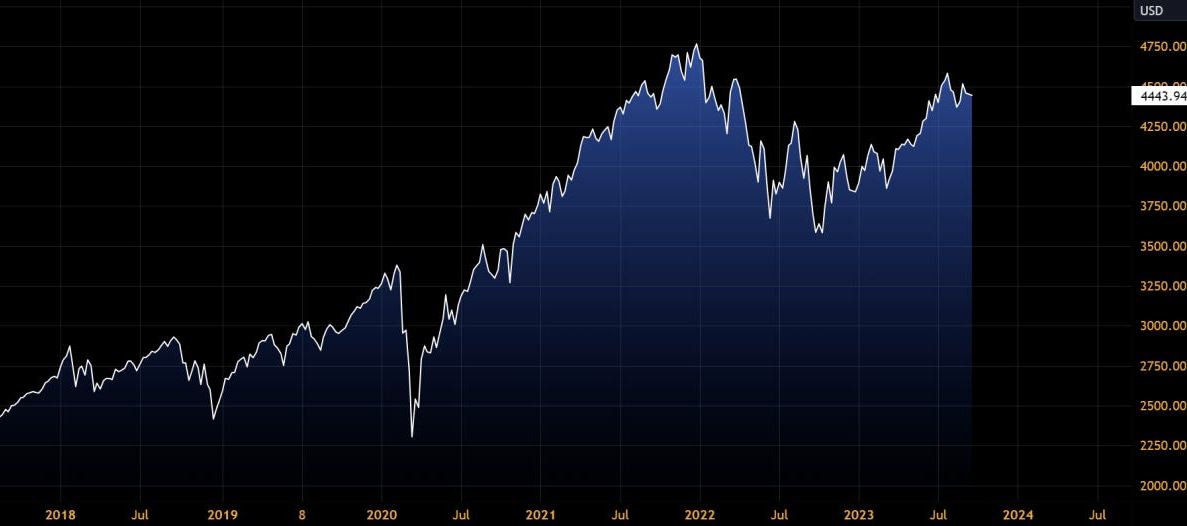
The stock market has been quite the rollercoaster since October 2022. At first, it was all sunshine and rainbows, with a whopping 25% surge that had investors cheering. But lately, this rally has been slowing down. This kind of market madness can really mess with people's heads and make it tough to make investment decisions. It's a reminder that during these uncertain times, staying cautious and well-informed is key.
Well, let's dive into the world of the bears those folks who were convinced that an economic doomsday was just around the corner back in October. Funny thing is, they might be scratching their heads right about now because the market seems to be playing a different tune. You could make a case that this whole market rally doesn't quite add up. It's largely being driven by the big tech giants and the marvels of artificial intelligence just look at companies like NVIDIA. I think a big part of what's happening has to do with the psychology of the people in the market. See, the market took a U-turn in October when almost everyone and their dog was pessimistic. Fast forward to today, and you still have a bunch of folks yelling that the world is ending every time the S&P 500 dips a bit.
In my humble opinion, there might still be some room for the market to climb higher. Maybe it's just to scare away a few more bears before doing a U-turn again, possibly around mid 2024. Now, this paper isn't going to rely on a bunch of opinions. No, were going to dive into the charts and the data to make sense of this crazy market ride. By looking at the historical trends and market dynamics, we're going to try and figure out why the market is behaving the way it is and what might come next.
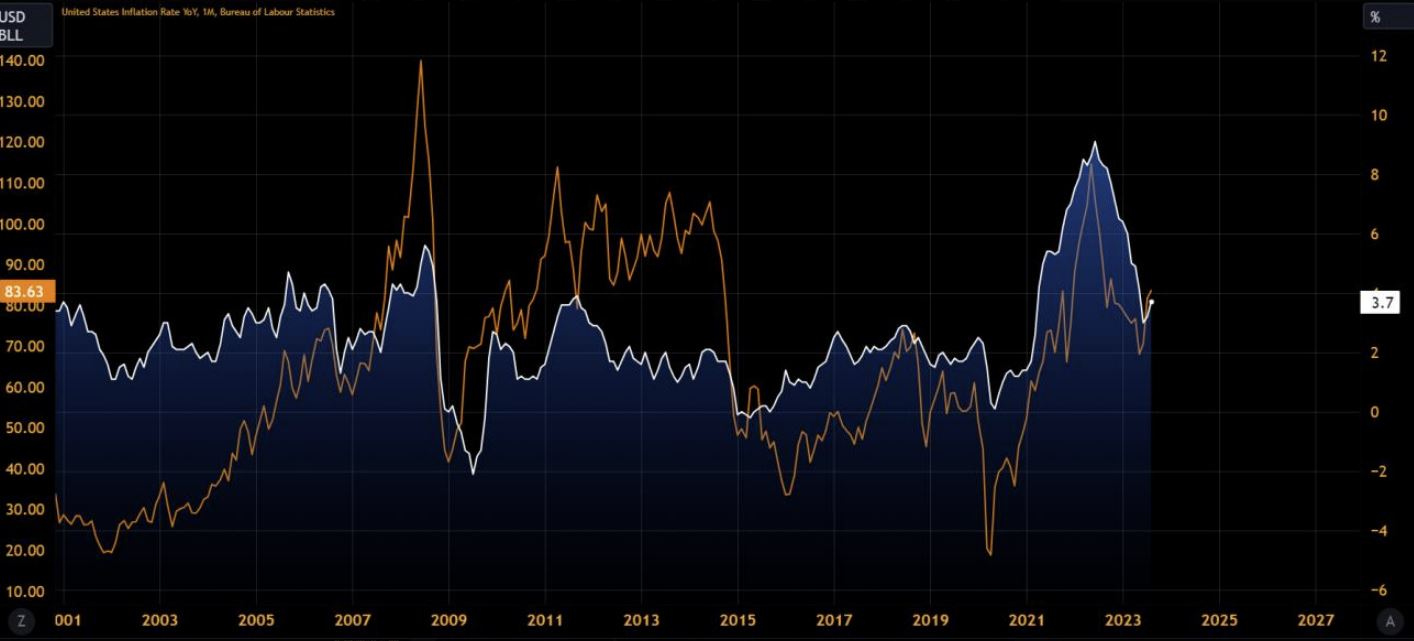
The inflation figures from last Wednesday didn't hold many surprises. The headline rate stood at 3.7%, while the core inflation rate came in at 4.3%. It's worth noting that inflation had hit a low point at 3.0% in July but has been steadily climbing since then. This upward trajectory parallels the historical pattern where oil prices, acting as a leading indicator, tend to foreshadow inflationary trends.
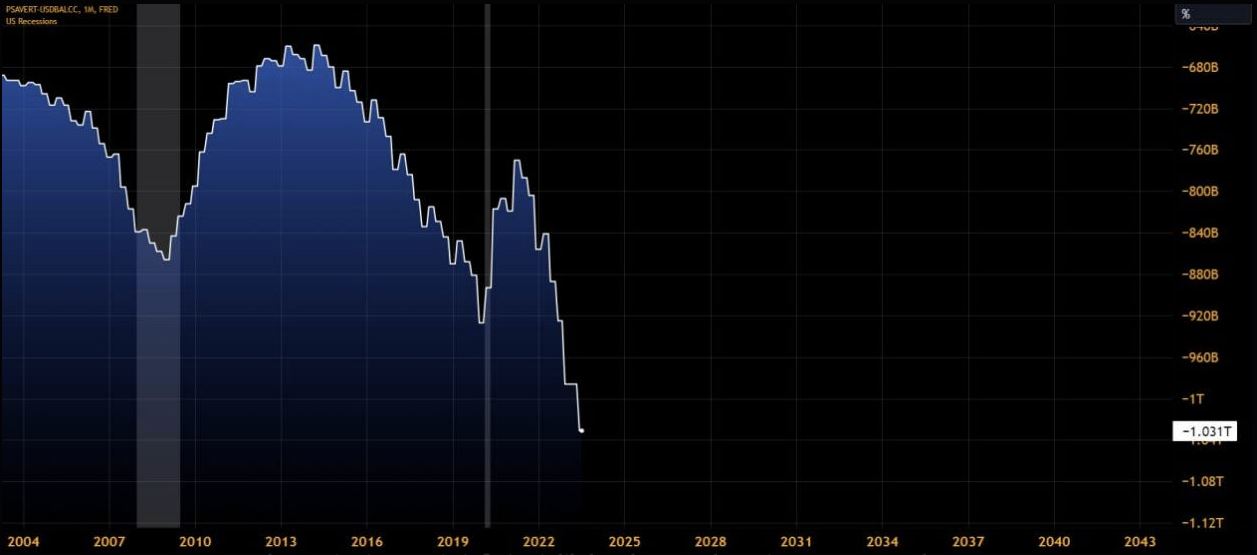
The ongoing increase in inflation is likely to have an adverse impact on personal savings, potentially leading to a decline. Simultaneously, the rise in credit card debt is expected to exacerbate this situation, widening the gap even further. This chart illustrates this spread and a significant pattern: historically, a recession tends to be more probable when this gap reaches its lowest point and might be on the brink of undergoing a mean reversion.
The Fed is trying to counter inflation by rising the interest rate. The Fed Funds Rate is currently at 550 BSP and seems to slowy flatten.
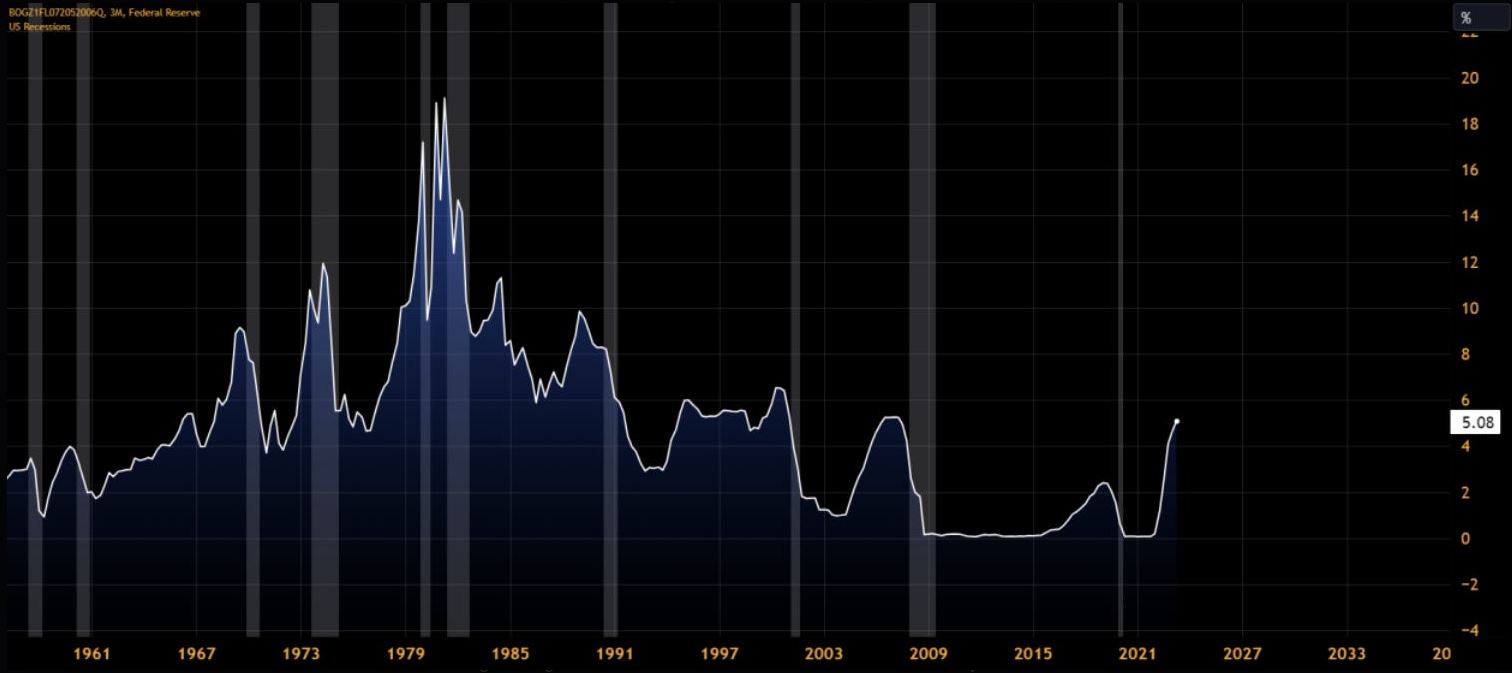
In today's FOMC meeting, Federal Reserve Chair Jerome Powell opted not to raise interest rates further. He emphasized his commitment to achieving the goal of bringing inflation back to 2%. Powell also expressed the need to await the full impact of recent tightening measures on the market. He made it clear that any future rate hikes would be data-driven, dependent on forthcoming economic data.
The impact of increasing interest rates is gradually becoming evident among the general public, particularly in the form of a rising default rate in credit card loans issued by smaller lenders. This trend is further emphasized by the escalating levels of credit card debt, as illustrated in this Graph.
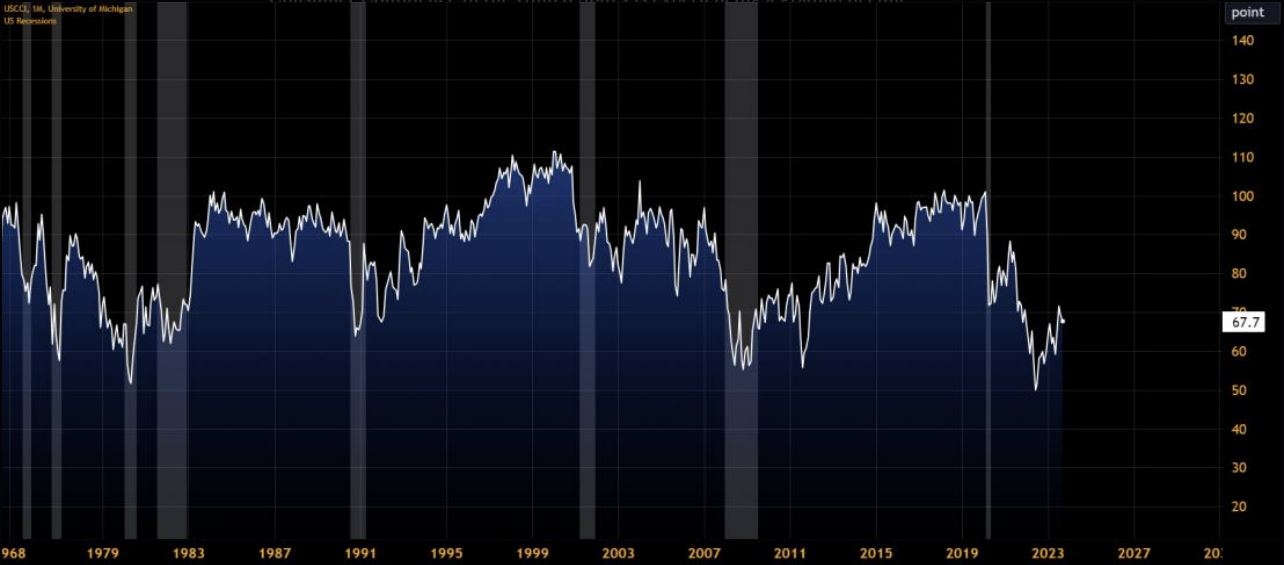
Consumer Confidence in the United States is experiencing a gradual decline, punctuated by a brief uptick. This pattern suggests growing pessimism among U.S. households regarding their current financial situations and future expectations. If this decline continues, and reverses like on the 90s level, it could signify even greater apprehension among consumers about their personal financial prospects.
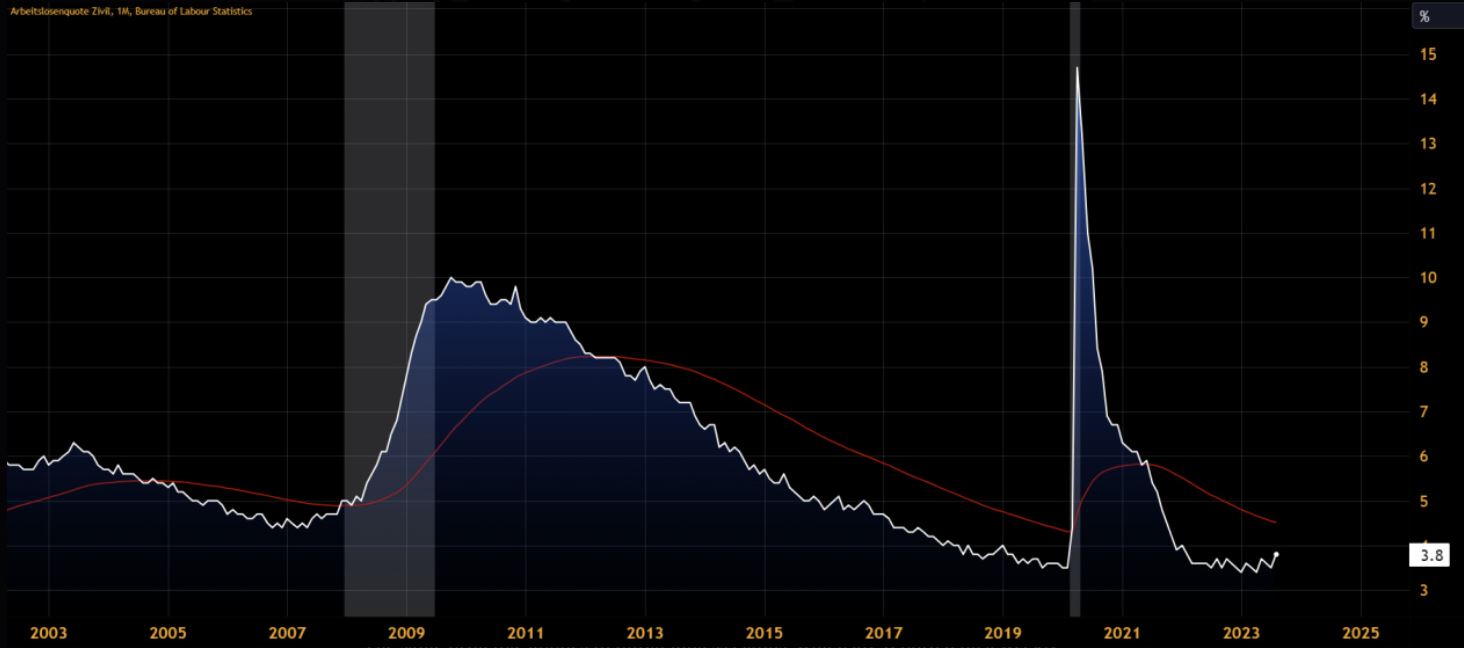
As financial conditions continue to tighten, there's a growing concern that an uptick in the unemployment rate may not be too distant. If we continue to observe higher unemployment figures in the coming months, there's a possibility that the unemployment rate could gradually approach the 12-month moving average, much like what occurred in 2007. This historical pattern has proven to be a remarkably reliable indicator of impending recessions over the past several decades.
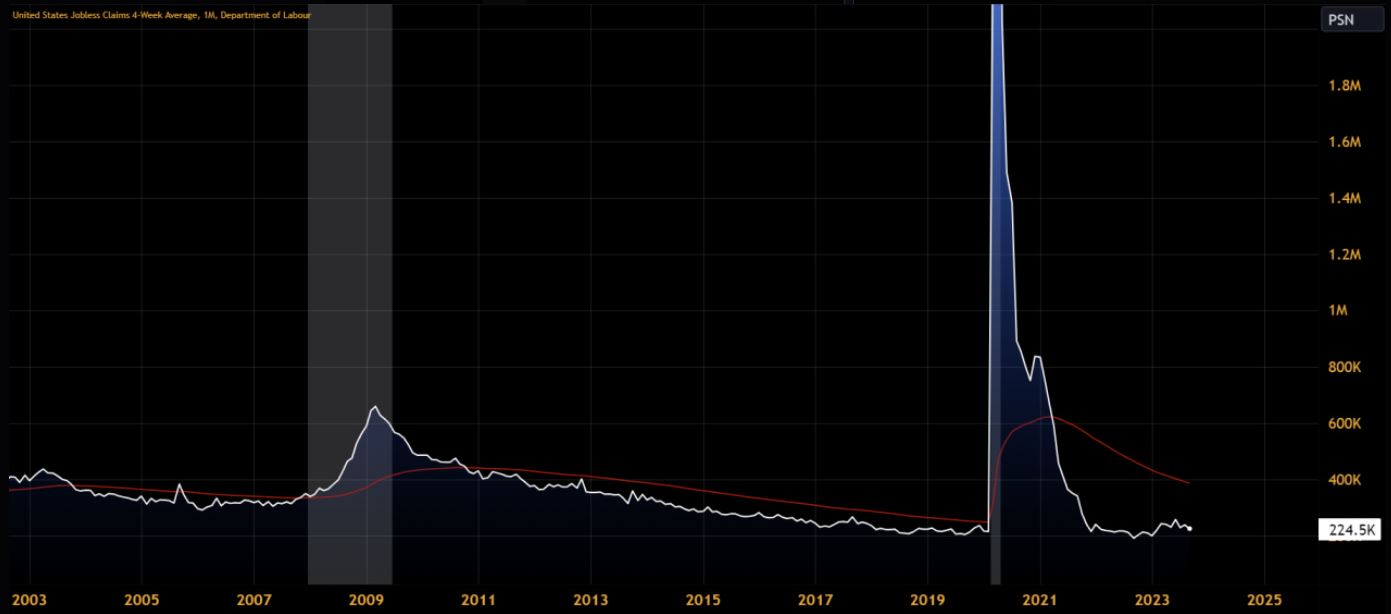
The same principle applies to initial jobless claims, which are reported on a weekly basis, in contrast to the monthly reporting of the employment rate.
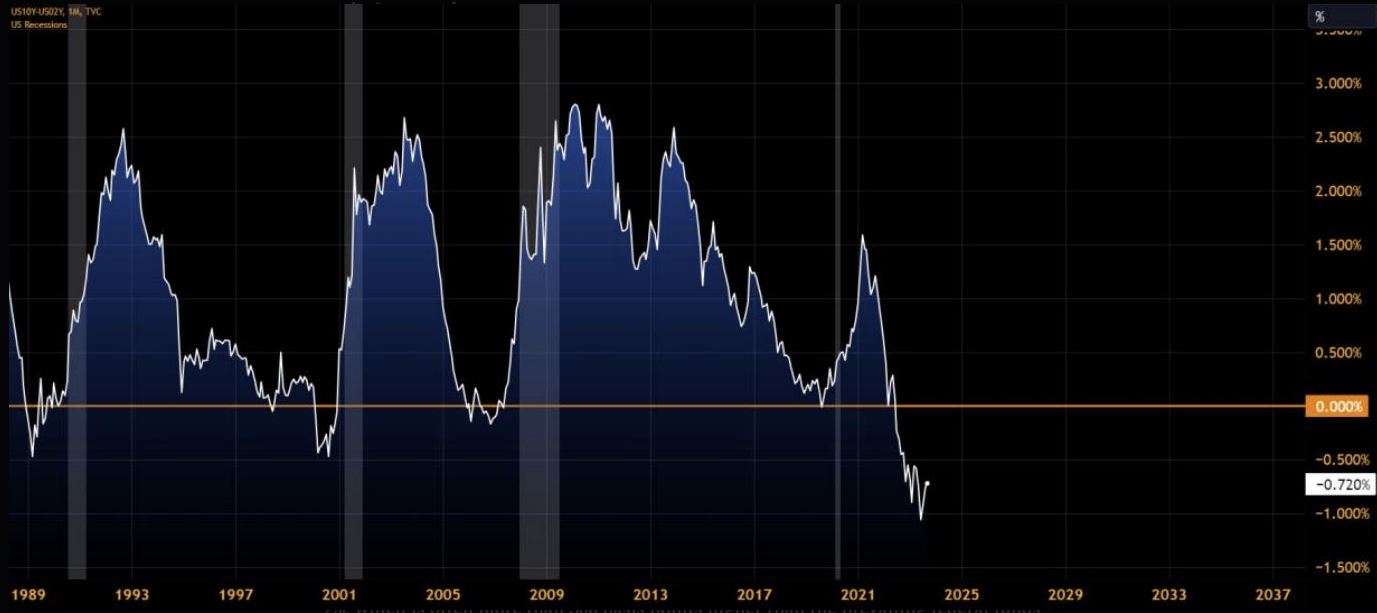
One of the most widely recognized and closely watched indicators in the financial world is the yield spread between the 10-Year Treasury and the 2-Year Treasury. As of the most recent data, this spread has reached a notable -0.72%. To put this into context, it's currently at its lowest level since the 1980s. The significance of this particular yield spread lies in its historical track record as a reliable predictor of economic cycles. When the yield curve, represented by the relationship between long-term (10-Year Treasury) and short-term (2- Year Treasury) bond yields, starts to invert meaning short-term yields exceed long-term yields—it has consistently served as a precursor to economic downturns. This historical consistency is evident when analyzing past data.
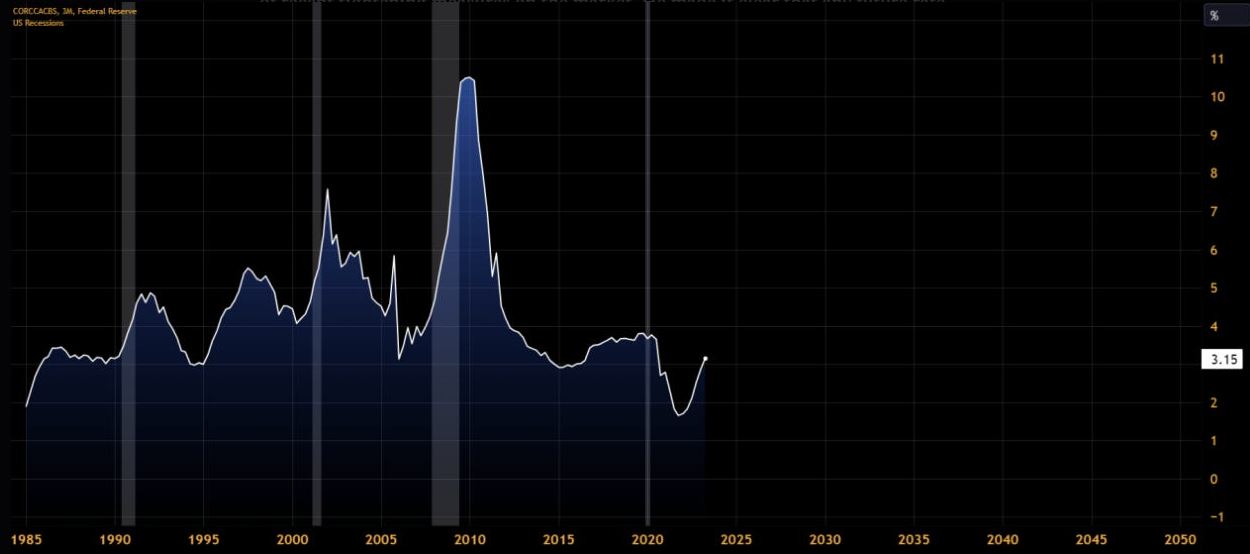
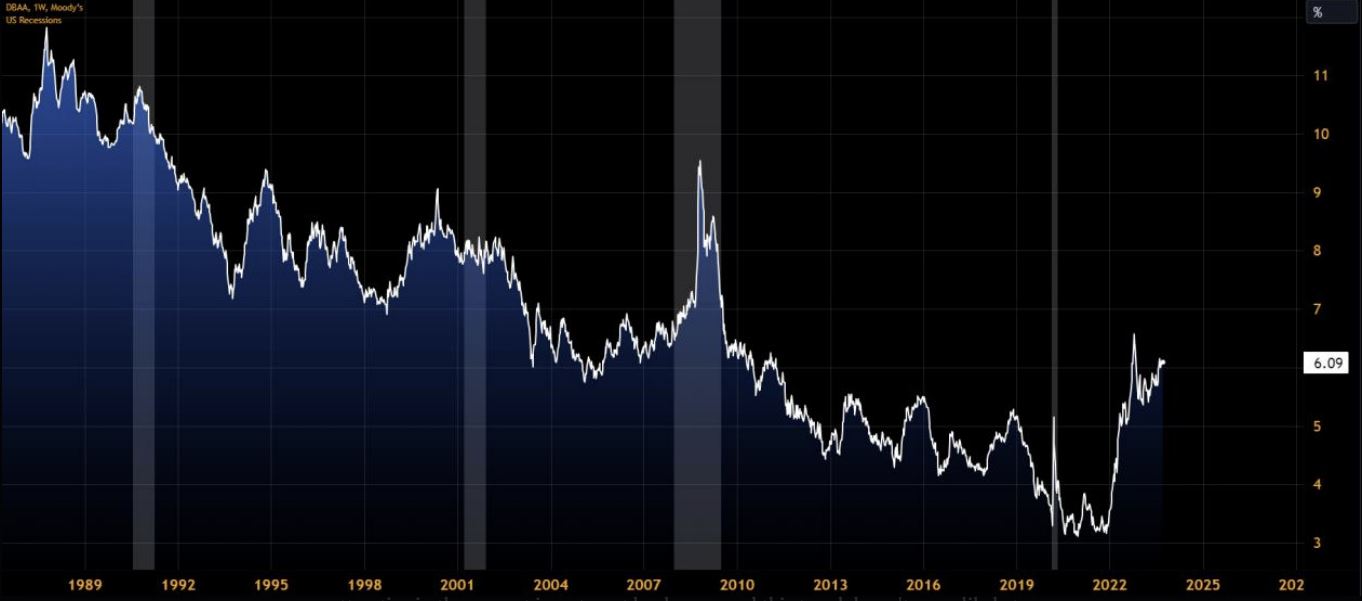
Notably, not only are short-term bills and notes offering higher yields than usual, but BAA-rated corporate bonds are also reflecting elevated yields. This phenomenon can be attributed to the market's heightened risk perception, potentially stemming from ongoing market turbulence and concerns about the issuer's ability to fulfill its debt obligations. This trend is further fueled by the substantial interest rates that businesses are currently paying on short-term loans. In many cases, these rates exceed 9%, which is often more than 300 basis points higher than the prevailing federal funds rate.
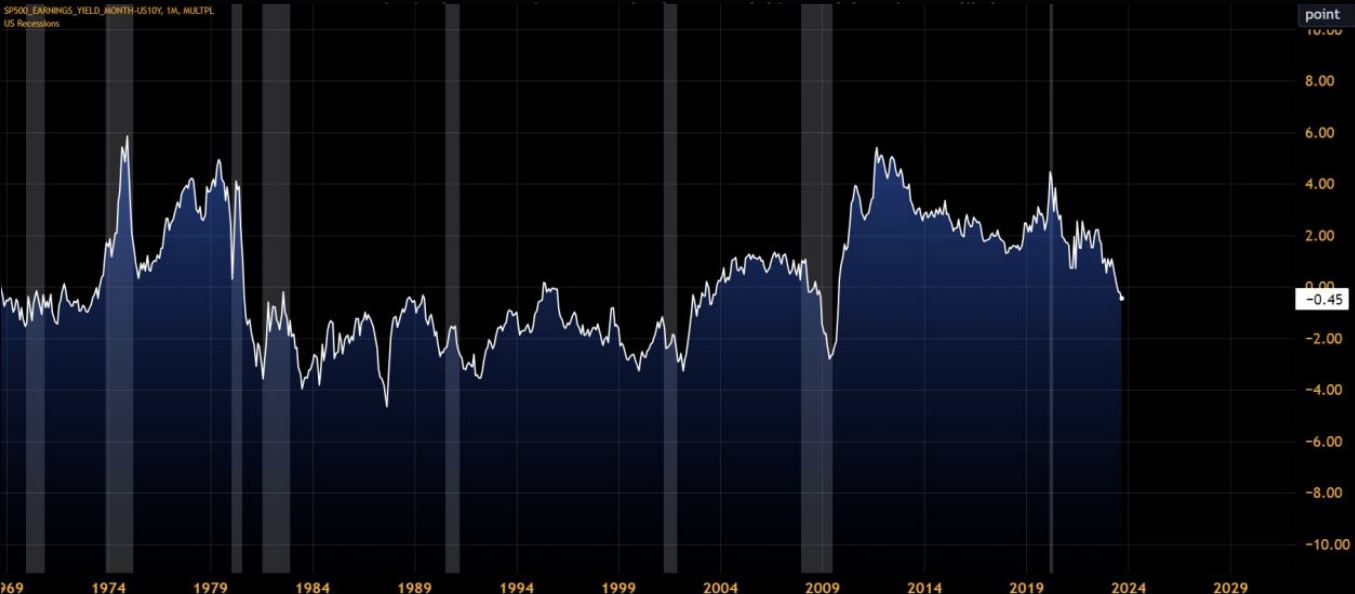
When we examine the spread between the S&P 500 earnings yield and the yield on 10-year Treasury bonds, a clear picture emerges: stocks appear to be relatively unattractive in the current investment landscape, and this trend doesn't seem likely to change in the near future. The widening spread between the S&P 500 earnings yield and 10-year Treasury yields suggests that investors are finding greater appeal in the safety and stability of Treasury bonds compared to the potential returns from stocks.
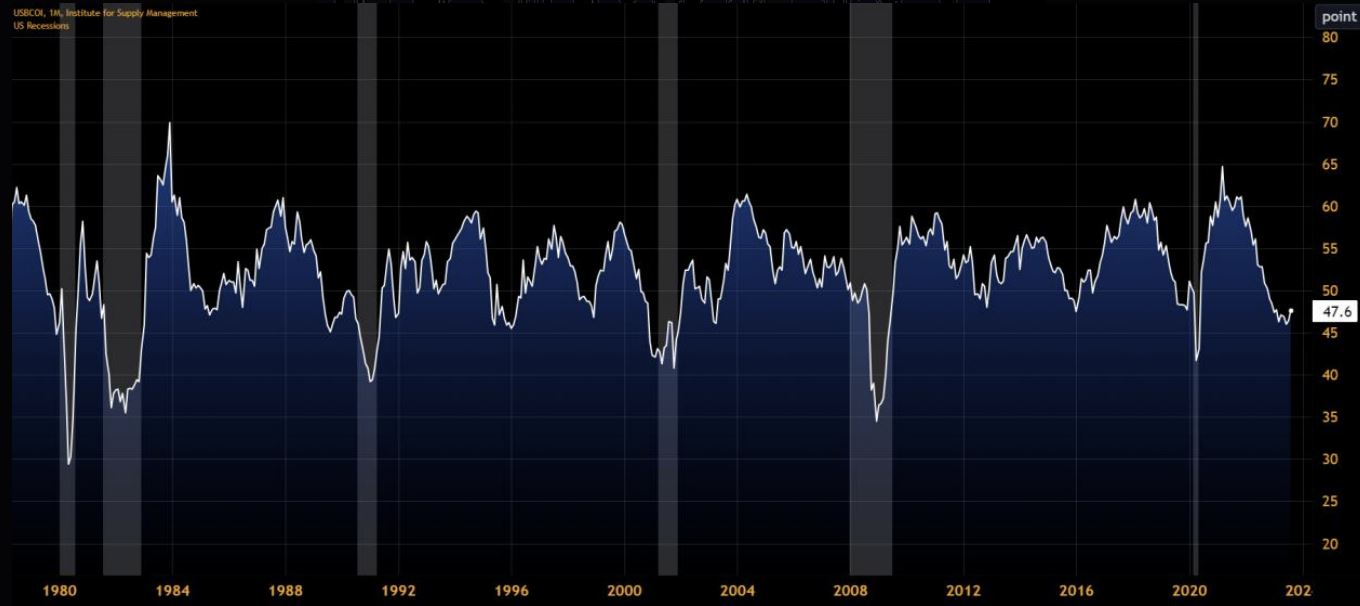
The ISM Index appears to be establishing a support level around 47, which closely mirrors the levels witnessed during the 2020 economic downturn. If this support is breached on the downside, it could signal the potential for a more significant economic slowdown.
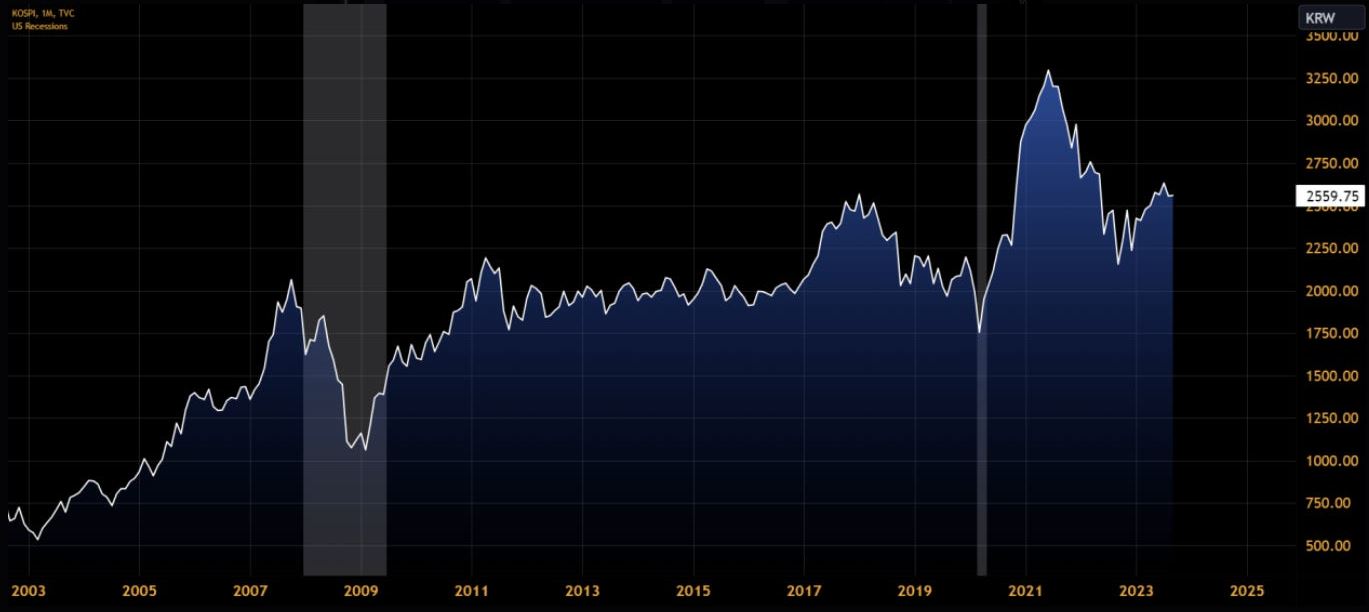
Additionally, the KOSPI (Korean Composite Stock Price Index) offers valuable insights into the health of the US economy. Given South Korea's substantial trade surplus, fluctuations in the KOSPI can serve as an indicator of potential import slowdowns into the US, potentially signaling the onset of a recession.
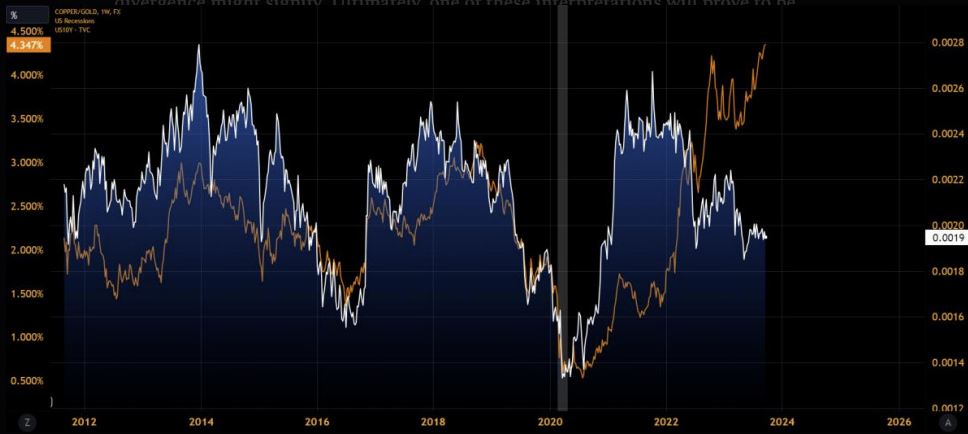
The chart displaying an unusual pattern shows the divergence between the COPPER/GOLD spread and the 10-Year US Treasury yield. In the chart below, it's evident that the COPPER/GOLD spread and the 10-Year US Treasury yield began to diverge in the middle of 2022. This intriguing phenomenon leaves room for interpretation, and it's clear that there are differing perspectives on what this divergence might signify. Ultimately, one of these interpretations will prove to be accurate.
The journey isn't concluded as of now, even though it might appear superficial. Signs of a potential downturn in 2024 are becoming increasingly apparent. While we may experience some additional minor upturns, as I mentioned earlier, the likelihood of a recession in mid-2024 is growing more probable than not. Historically, when the Federal Reserve begins to reduce interest rates, it often signals that challenging economic times are on the horizon. Hopefully we arent turning japanese
Turning Japanese - The Vapors
Thanks